Here’s what the first two trading days of January predict for stocks in 2025

The absence of a “Santa Claus rally” does not doom the U.S. stock market in 2025.
The period from Christmas through the second trading day of January marks the traditional definition of the Santa Claus rally. Over the past century, the U.S. stock market during this period has risen more frequently than over other periods of comparable length.
This time, though, the market is more Scrooge-like. From Christmas through the second trading day of January, the Dow Jones Industrial Average DJIA lost 1.3%, while the S&P 500 SPX lost 1.6%. So, even with the market’s rebound on Jan. 3, Santa Claus failed to call on Broad and Wall this year.
This is bad news, according to those on Wall Street who believe that a loss during the Santa Claus rally period means 2025 is likely to be a losing year for the stock market. But there’s little evidence to support this fear. The odds of a rising stock market are not significantly different following year-end periods in which there is a Santa Claus rally and when there is not.
Take the last time the Dow fell during the Santa Claus rally period, which was nine years ago. From Christmas Day in 2015 through the second trading day of 2016, the Dow fell 2.2%. Yet, far from signaling a bad year, the stock market soared — with the Dow gaining 15.2% from the second day of 2016 through the end of the year.

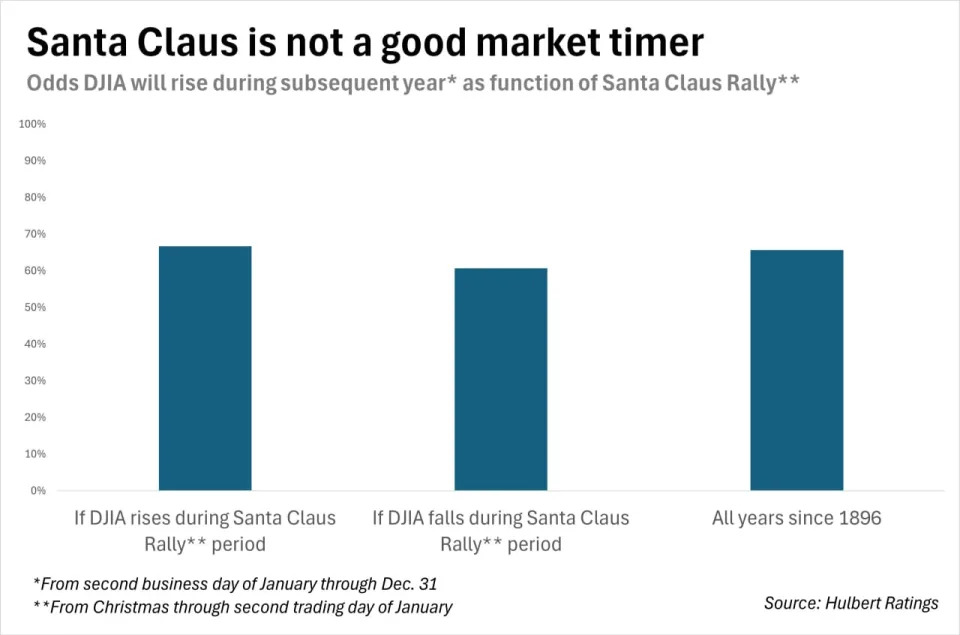
This is just one data point, but the historical averages tell a similar story, as you can see from the chart above, which is based on the Dow back to its creation in 1896. Notice that the market has risen in 65.6% of the years since then.
Following Santa Claus rally periods in which the market rose, the odds of a rising market increased slightly to 66.7%. Following Santa Claus rally periods in which the market fell, the odds of a rising market fell to 60.7%. The differences between these odds are not significant at the 95% confidence level that statisticians often use when determining if a pattern is genuine.
(Many commentators focus on the S&P 500 rather than the Dow when assessing the Santa Claus rally. I chose the Dow because of its longer history, though my conclusions would be the same had I focused on the S&P 500.)
You shouldn’t be surprised by these results, for several reasons. First, it’s unlikely that there ever was statistically significant support for the notion that the stock market’s calendar-year return was correlated with how it performed between Christmas and the second trading day of January. But even if there had been, widespread knowledge of that correlation would have led to the pattern’s disappearance.
The bottom line? What the market does this year will have nothing to do with how it has performed over the past week.
Mark Hulbert is a regular contributor to MarketWatch. His Hulbert Ratings tracks investment newsletters that pay a flat fee to be audited. He can be reached at
More: These stock-trading moves can boost a portfolio if the ‘Santa Claus rally’ fails
Plus: What stocks’ worst stumble since 1952 may mean for 2025

