Watch These Boeing Price Levels as Stock Slips After South Korean Crash

Key Takeaways
Boeing ( BA ) shares will likely remain on investors’ radar screens after slipping more than 2% Monday following news that South Korea ordered an inspection of all 737-800 planes in the aftermath of a Jeju Air crash over the weekend that killed 179 people.
Boeing shares have had a turbulent 2024, weighed down by a series of aircraft quality issues and a prolonged strike by its union machinists that prompted the company to raise additional capital in a bid to preserve its investment-grade credit rating and stem its cash drain.
Although the stock has lost one-third of its value this year, it has recovered around 14% over the past month as of Monday’s close, after the company reported earlier in December that it had restarted production of its troubled 737 MAX jets.
Below, we take a closer look at Boeing’s weekly chart and use technical analysis to point out important price levels worth watching out for.
Falling Wedge Breakout
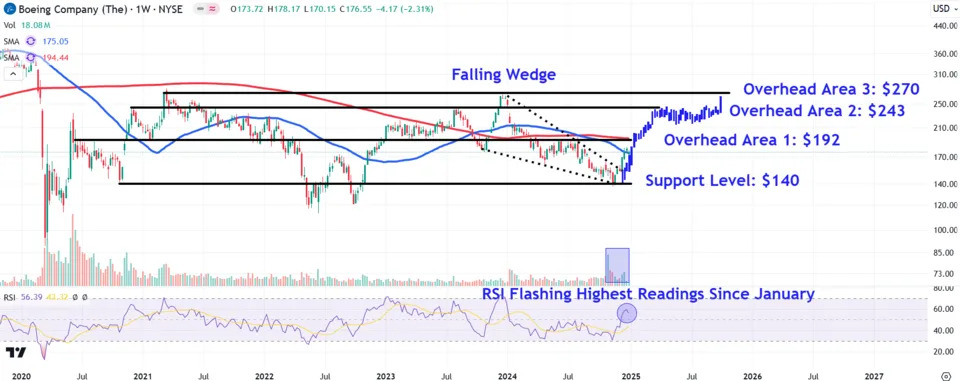
Boeing shares have trended higher after breaking out from a falling wedge on above-average volume earlier this month, signaling a potential bullish reversal.
Despite today’s news -driven decline, the stock remains above the closely watched 50-week moving average (MA), indicating underlying buying pressure. Moreover, the relative strength index (RSI) confirms improving price momentum, with the indicator flashing its highest readings since January.
Let’s identify three important overhead areas on the Boeing chart to watch, as well as a crucial support level to monitor if the shares undergo a retracement.
Important Overhead Areas to Watch
Further upside could see the shares climb to around $192. This area may provide resistance near the downward sloping 200-week MA and a trendline that connects a range of comparable price action on the chart from June 2020 to July this year.
A close above this location may propel a move to the $243 area, a region on the chart where investors could decide to take profits near prominent swing highs that formed in December 2020 and July 2023.
Buying above this level opens the door for a retest of higher overhead resistance around $270, an area where the shares may encounter selling pressure near prominent peaks in March 2021 and December last year. Interestingly, this region also roughly aligns with a bars pattern projected target that extracts the stock’s uptrend from October 2022 to July last year and repositions it from this year’s November low.
Crucial Support Level to Monitor
Upon a retracement, investors should keep a close eye on the $140 level. Buy-and-hold investors may look for entry points around this area near the falling wedge pattern’s lower trendline, which also closely aligns with range of similar price points extending back to October 2020.
The comments, opinions, and analyses expressed on Investopedia are for informational purposes only. Read our warranty and liability disclaimer for more info.
As of the date this article was written, the author does not own any of the above securities.
Read the original article on Investopedia

