‘Santa Claus rally’ is here — but can the stock market avoid the ‘Grinch pinch’?

The S&P 500 Index SPX is attempting to erase the swift decline that occurred after the U.S. Federal Reserve’s December meeting. SPX has rallied, VIX VIX has fallen, and there’s been general improvement in the U.S. stock market’s internal indicators. Moreover, this is the beginning of another seasonally bullish period — the so-called Santa Claus rally.
Can stock investors count on a stampeding bull once again? Not quite yet — but the bears have failed to seize control.
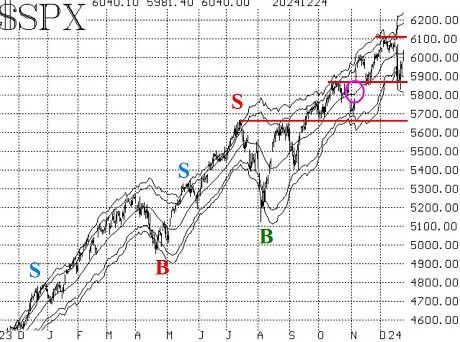
The previous SPX support level at 5,870 was tested on the recent decline, and it held, on a closing-price basis. That is certainly an important support level. As for overheard resistance, there is some at 6,010, with the major resistance at the all-time highs near 6,100. So, currently, the market is in a rather wide trading range between those two levels, 5,870 and 6,100. A breakout in either direction should gather momentum quickly.
There is support at 5,670 — see the SPX chart below — but if the market fell that far, the chart would no longer be bullish. For the record, the McMillan Volatility Band (MVB) buy signal of last August is still in effect. In reality, we have rolled positions based on that signal up several times along the way. The signal persists since SPX has not touched its +4σ band since the signal was initiated last August.

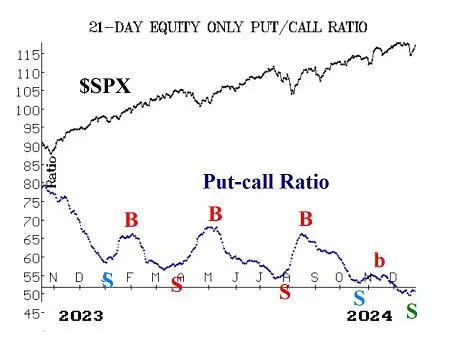
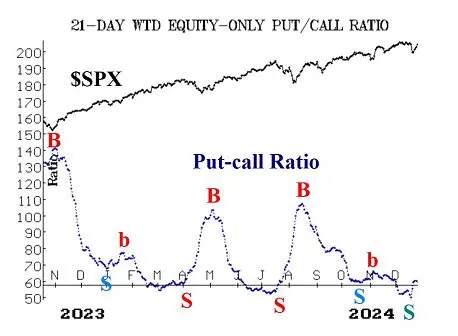
Equity-only put-call ratios began to rise when the market sold off last week, but now the rise in the ratios may be stalling out. A rising put-call ratio is negative for the stock market, and so that rise appeared to be the beginning of a sell signal. But we’ve seen a similar pattern several times in the past year — the ratios rise from extremely low levels (i.e., levels that indicate the stock market is overbought) but then fail to follow through. Note the action in both January and October. At this time, these equity-only put-call ratio sell signals are certainly in question; the ratios would have to begin to rise sharply (again) in order for these to be considered bearish indicators.


Market breadth was one of the most negative indicators, and the breadth oscillators generated well-timed sell signals prior to stocks’ most recent decline. Breadth is improving in the current rally, though, and another day of positive breadth is likely to terminate the sell signals from these breadth oscillators. For buy signals to occur, breadth would have to continue to improve.
New lows on the NYSE have continued to outnumber new highs, although even that measure is beginning to wane as the market rallies. Currently, this longer-term indicator is on a sell signal, but, if new highs were to outnumber new lows on the NYSE for two consecutive days, that would stop out the sell signal.
VIX spiked up above 28 on the recent stock-market decline, but it’s now around 15. That is certainly a spike peak, and there’s a “spike peak” buy signal in place. Moreover, as shown on the VIX chart below, VIX is also back below its 200-day moving average. Since the 20-day moving average, or MA, of VIX is also below its 200-day MA, that is a potential “trend of VIX” buy signal. It would be confirmed if those conditions exist again today — or, more simply stated, the buy signal would take effect if VIX closes below 15.80 today.
The construct of volatility derivatives is bullish in its outlook for stocks. The term structures slope upward, and VIX futures are trading at a premium to VIX. The first signs of worry would be if January VIX futures were to trade in price above February VIX futures, but that is nowhere near occurring at this time.
In summary, we are continuing to maintain our core bullish position as long as SPX closes above 5,870. However, we will trade other confirmed signals around that core. Moreover, we will continue to roll deeply in-the-money options to lock in partial profits and reduce risk.
Market insight: The Santa Claus rally
A seasonally bullish pattern — the “Santa Claus rally” — began with Tuesday’s trading (Dec. 24). First identified by market analyst Yale Hirsch in the 1960s, the seasonal pattern encompasses the last five trading days of one year and the first two of the next year. Typically, it is a bullish period, with SPX rising just over 1% (about 60 points in today’s terms).
But if the period should produce a loss, Hirsch’s memorable phrase applies: “If Santa Claus should fail to call, bears may come to Broad and Wall.” In other words, the outlook for stocks can be quite negative if the market does not rally during this period.
We are going to trade this seasonal pattern:
Buy 1 SPY SPY (Jan. 10) at-the-money call: Roll the call up if it becomes eight points in-the-money. Otherwise, plan to exit the trade at the end of the trading day on Jan. 3, the second trading day of 2025.
Read: Stock market’s December performance in balance as ‘Santa Claus rally’ begins
New recommendation: Potential ‘trend of VIX’ buy signal
A new “trend of VIX” buy signal will occur on Thursday, Dec. 26, if VIX closes below 15.80. These signals do not necessarily mean that VIX is trending lower (there isn’t much room for it to decline from current levels), but they do mean that the stock market should normally be trending higher.
If VIX closes below 15.80 on Dec. 26, then buy 1 SPY (Feb. 21) at-the-money call and sell 1 SPY (Feb. 21) call with a striking price 20 points higher.
If this trade is made, it will be held until VIX closes above its 200-day MA for two consecutive days.
New recommendation: American Battery Technology calls
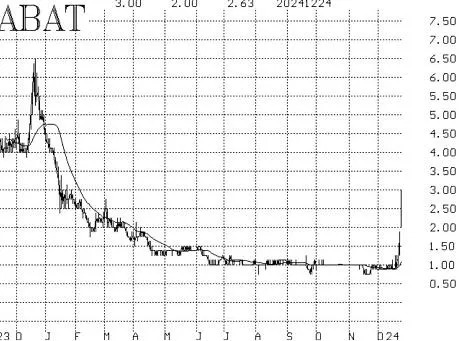
This low-priced stock has spiked upward on heavy stock- and option-trading volume. The catalyst was a new contract with the Department of Energy.
Buy 6 American Battery ABAT (Jan. 17) 2.5 calls at a price of 0.80 or less.
Initially we will hold without a stop.

Follow-up actions:
We are using a standard rolling procedure for our SPY spreads. In any vertical bull or bear spread, if the underlying hits the short strike, then roll the entire spread. That would be roll-up in the case of a call bull spread or roll-down in the case of a bear put spread. Stay in the same expiration and keep the distance between the strikes the same unless otherwise instructed.
Also, for outright long options, roll up if they become eight points in-the-money.
Long 1 expiring SPY (Dec. 27) 607 call: This is our “core” bullish position. Roll to the SPY (Jan. 24) 607 call. Stop out of the position if SPX closes below 5,870 for two consecutive days.
Long 4 expiring WBA WBA (Dec. 27) 9 calls: This is the “alternative” Dogs of the Dow position. Roll to the WBA (Jan. 17) 9 calls. Hold without a stop at this time. A takeover rumor is in effect, following a Wall Street Journal report that Walgreens Boots Alliance is in talks to sell itself to private-equity firm Sycamore Partners .
Long 2 IWM IWM (Jan. 17) 241 calls and short 2 IWM (Jan. 17) 254: This is the post-Thanksgiving seasonal trade. We will plan to hold this trade through the second trading day of 2025, so the entire amount of the money in this trade is at risk. If IWM trades at 254, then sell the spread and replace it by buying the IWM (Jan. 17) call at that higher strike, holding it as an outright long.
Long 10 POET (Jan. 17) 5 calls: Sell the calls if POET POET closes below 4.25.
Long 1 SPY (Jan. 3) 589 put: We will hold this put as long as the breadth oscillator sell signal is in effect. That may be as soon as today. If breadth is positive on the NYSE today (Dec. 26), then sell these puts to close the trade.
Long 4 DKNG (Jan. 17) 42 puts: We will hold these puts as long as the weighted put-call ratio for DKNG DKNG remains on a sell signal.
Long 1 SPY (Jan. 17) 590 put and Short 1 SPY (Jan. 17) 550 put: This position is based on the “new highs vs. new lows” sell signal. This position will be held until new highs exceed new lows on the NYSE for two consecutive days.
Long 1 SPY (Jan. 24) 586 call and Short 1 SPY (Jan. 24) 606 call: This position is based on the latest “spike peak” buy signal. This trade would be stopped out if VIX were to close at a higher price than the previous peak (28.32). Otherwise, the position will be held for 22 trading days.
Long 3 VRAR (Jan. 17) 4 calls: at a price of 1.90 or less. Stop out of this trade if VRAR VRAR closes below 2.40.
Send questions to: [email protected] .
Lawrence G. McMillan is president of McMillan Analysis, a registered investment and commodity trading advisor. McMillan may hold positions in securities recommended in this report, both personally and in client accounts. He is an experienced trader and money manager and is the author of “Options As A Strategic Investment.”
©McMillan Analysis Corporation is registered with the SEC as an investment advisor and with the CFTC as a commodity trading advisor. The information in this newsletter has been carefully compiled from sources believed to be reliable, but accuracy and completeness are not guaranteed. The officers or directors of McMillan Analysis Corporation, or accounts managed by such persons may have positions in the securities recommended in the advisory.

