Watch These Tesla Price Levels as Stock Accelerates to Fresh Record High

Key Takeaways
Tesla ( TSLA ) shares continued their extended post-election rally on Monday, hitting a new record high after Wedbush boosted its price target on the EV maker's stock.
The investment firm lifted its price target to $515 from $400 but noted that the stock could reach as high as $650 by the end of next year, arguing that the incoming Trump administration will give the legacy EV maker’s self-driving and artificial intelligence (AI) initiatives a boost.
Through Monday’s close, Tesla shares have surged about 85% since the start of the year, with most of those gains coming after the Nov. 5 election on optimism that CEO Elon Musk’s close ties with President-elect Donald Trump will streamline the automaker’s approval processes.
The stock gained 6% in regular trading Monday and added another 2% in extended hours, trading around $472.
Below, we break down the technicals on Tesla’s chart and point out key chart levels that investors may be watching as the EV maker’s stock continues to make new highs.
Bullish Trend Moves Further into Overbought Territory
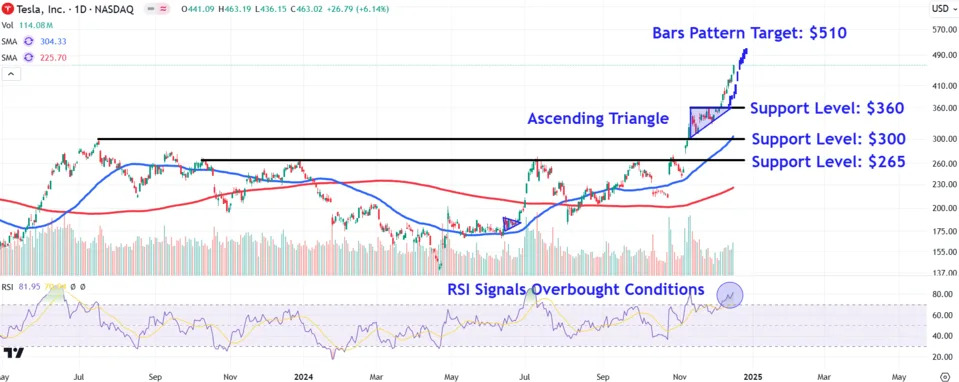
Since breaking out from an ascending triangle earlier this month, Tesla shares have trended sharply higher, with increasing trading volumes supporting the rally.
While the relative strength index (RSI) confirms bullish price momentum, the indicator also signals heavily overbought conditions, opening the door to short-term profit-taking as some investors cash in on the stock’s extended post-election gains.
Let’s turn to technical analysis to provide insight as to where the stock’s current impulsive move higher may be headed next and identify key support levels that may come into play during pullbacks .
Chart-Based Bullish Target to Watch
To forecast a bullish target in Tesla shares, investors can use bars pattern analysis, a technique that studies historical trends to predict how future directional moves may play out..
When applying the tool to Tesla’s chart, we extract the stock’s sharp trending move from late June to early July and overlay it from the ascending triangle’s top trendline. This projects a bullish target around $510, a location where investors may decide to lock in profits if the current move higher replicates the prior strong trend analyzed.
Key Support Levels to Monitor
During retracements , investors should initially keep an eye on the $360 level, a location on the chart where the shares may encounter support on a retest of the ascending triangle’s top trendline.
A close below this area could see the shares fall to around the psychological $300 level. Investors may look for buying opportunities in this region near the prominent July 2023 swing high and nearby 50-day moving average .
Finally, a significant correction in Tesla shares may lead to retest of lower support near $265. This level would likely attract buying interest near a trendline that connects multiple peaks on the chart over a 12-month period between October 2023 and October this year.
The comments, opinions, and analyses expressed on Investopedia are for informational purposes only. Read our warranty and liability disclaimer for more info.
As of the date this article was written, the author does not own any of the above securities.
Read the original article on Investopedia

