Warren Buffett’s portfolio tells all you need to know about the market’s next move

How good of a market timer is Warren Buffett? Many are asking, given the huge amount of cash and short-term investments that Berkshire Hathaway BRK.A BRK.B has built up — $325 billion as of the end of September , the latest data available.
Many interpret this to mean that Buffett expects a bear market, which would offer opportunities to put that cash to work — buying into companies at lower-than-current prices.
It’s hard to square that interpretation with Buffett’s long-standing belief that market timing is both impossible and stupid , however. The Berkshire chairman and chief executive insists that he has no idea where the economy and the stock market are headed, and that he has never made an investment decision based on a market-timing judgment.
It’s still possible that Berkshire Hathaway’s cash levels have market timing significance, however, notwithstanding Buffett’s denials. In other words, it might be that higher cash levels are followed by below-average market returns, and vice versa. Yet few if any have taken the trouble to analyze the historical data to find out for sure. For this column I set out to do so.

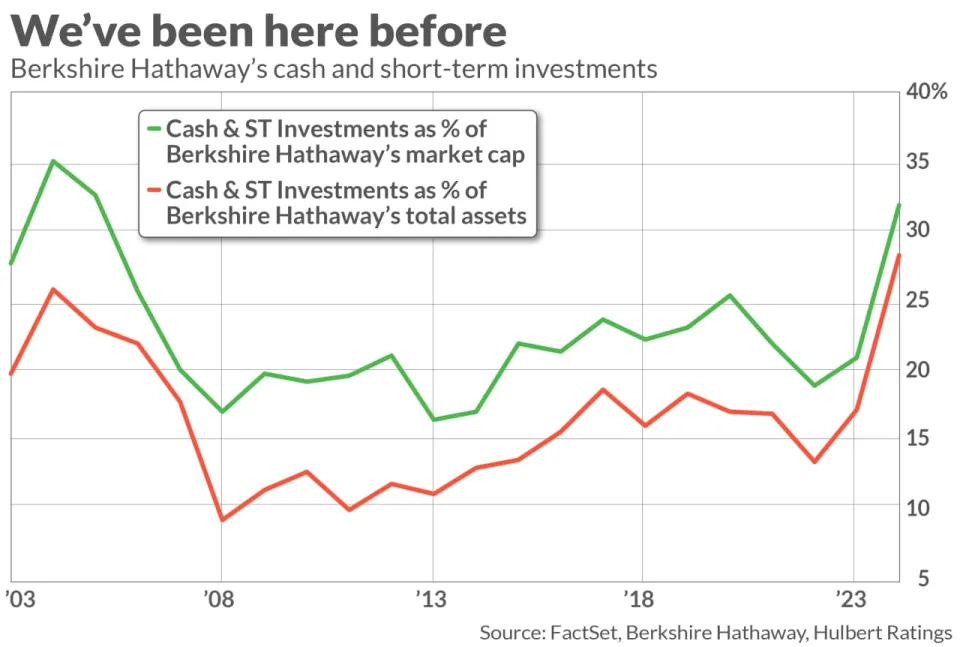
The accompanying above plots Berkshire’s cash and short-term investments over the past two decades, both as a percentage of the company’s total assets and as a percentage of its market value. When expressed in relation to the company’s size, Berkshire’s cash and short-term investments as of September were above-average but not a record. As a percentage of market cap, in fact, the record high occurred in 2004, when the total rose above 35%, in contrast to 32% as of the end of this year’s third quarter.
The U.S. bull market continued for almost three years following that 2004 record high cash level, but then the Global Financial Crisis hit. Whether that 2004 reading is a success or failure as a market-timing indicator depends on the length of your investment horizon.
That 2004 record high is just one data point. To search for systematic relationships, I measured the correlation between year-end cash levels at Berkshire Hathaway over the last two decades with the S&P 500’s SPX subsequent total return. At the one-year horizon, I found no statistically significant relationship. But at the five-year horizon there was a statistically significant inverse correlation; in other words, higher cash levels more often than not were followed by lower stock market returns, and vice versa.
The bottom line: Over longer-term horizons, the level of Berkshire Hathaway’s cash and short-term investments contains valuable information about the stock market’s prospects. Its near-record level therefore sends a sobering message about how much the market may struggle over the next several years.
Mark Hulbert is a regular contributor to MarketWatch. His Hulbert Ratings tracks investment newsletters that pay a flat fee to be audited. He can be reached at [email protected]
More: Why the Nasdaq’s 20,000 record high could spell trouble for investors next year
Also read: Fundstrat’s Tom Lee is no longer one of Wall Street’s biggest bulls. Why he’s cautious on 2025.

