This move by the stock market’s ‘fear gauge’ is historically bullish for the S&P 500

Traders have been rushing in to buy stocks in the final hour of trading over the past two weeks, while a gauge of expected S&P 500 volatility has dropped sharply in the wake of the presidential election.
History says those developments tend to bode well for the stock market in coming months, according to Dean Christians, senior research analyst at SentimenTrader, in a Monday note.
The Cboe Volatility Index VIX, often referred to as Wall Street’s “fear gauge,” measures expected S&P 500 SPX volatility over the coming 30-day period. The VIX ended Friday at a four-month blow, finishing below 14. Christians noted that was its first close below 14 since the index surged above 20 in early August, amid a brief but violent stock-market pullback.
The VIX scored an intraday high of above 65 on Aug. 5, subsequently pulling back as markets calmed to trade in a range between 14 and 23 from summer into fall. Market-moving events, such as the election, helped keep it elevated. Now, with the election in the rearview mirror, the VIX has slumped.
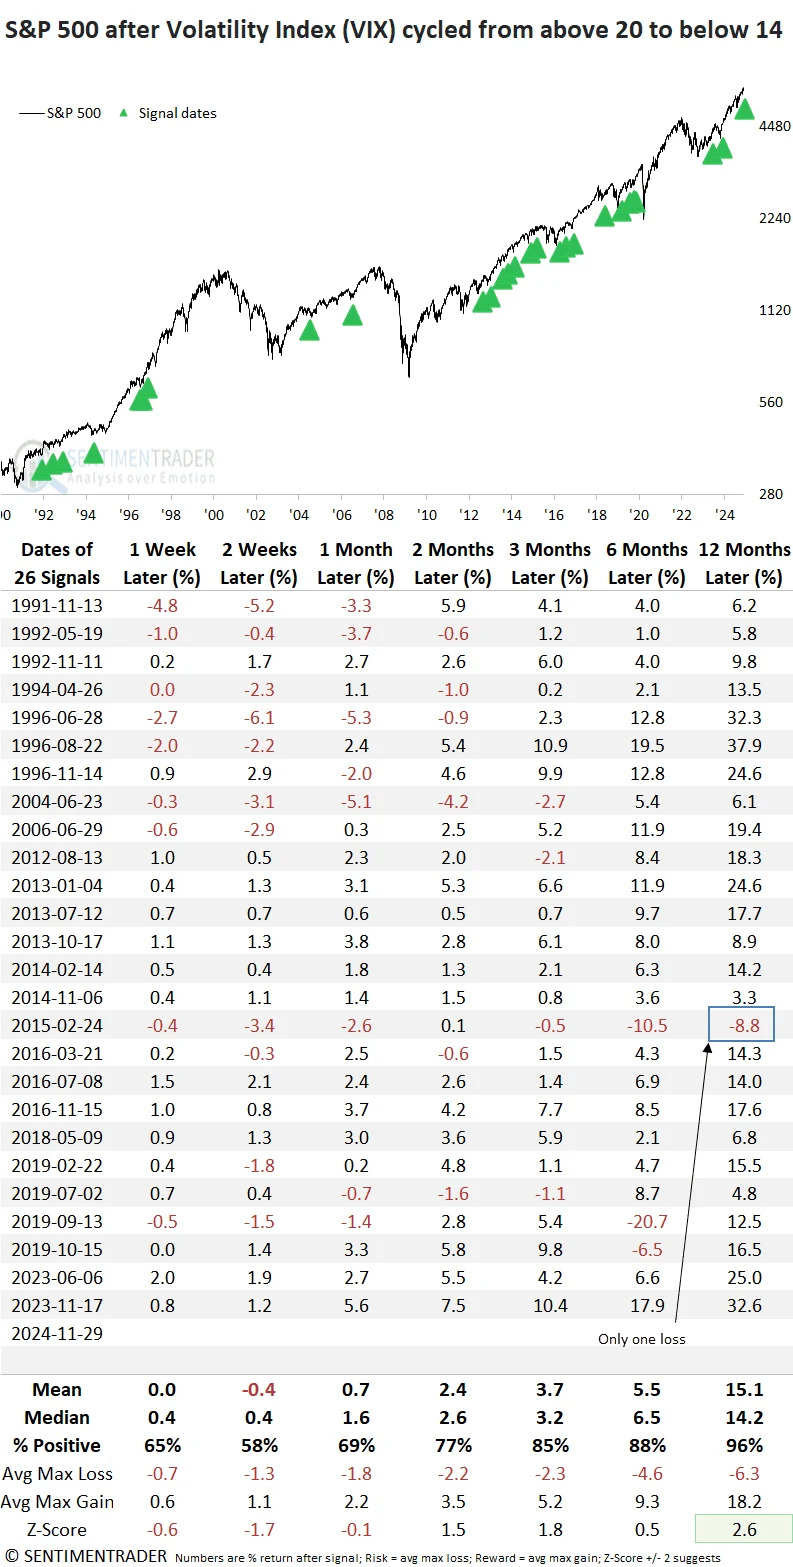
The last time the VIX dropped back below 14 after a push above 20, in the fall of 2023, the S&P 500 went on to score a 10% gain over the next three months, Christians said. And history shows that when the VIX has cycled above 20 and then dropped back below 14, “stocks have scored excellent returns and consistency over the medium- and long-term horizons,” he wrote.

As shown in the chart and table above, SentimenTrader found that in the 26 past instances of the VIX returning back below 14 after a push above 20, the S&P 500 has been higher a year later with only one exception in 2015. The median gain has been a rise of 14.2%.
Meanwhile, SentimenTrader’s last-hour indicator, which tracks the cumulative direction of the final hour of trading for the S&P 500, posted gains in nine of the last 10 sessions, Christians said — signaling traders rushing to complete buy orders amid wariness over the “upward drift” that often characterizes rising markets.
Looking at the past 21 times the indicator saw a rise in nine out of 10 sessions with the S&P 500 within 2% of its all-time high, the index rose 90% of the time over the following six months, Christians said. And while the three-month time frame was less favorable — up 81% of the time — it has recorded 14 straight gains starting in 1995.
Both the VIX signal and the last-hour indicator signal were triggered following Donald Trump’s 2016 election victory, when stocks soared into December and were then rangebound for six weeks before eventually resuming their rally.
The S&P 500 ended Friday at a record and booked a November gain of 5.7%, its best monthly advance of 2024. The S&P 500 has rallied nearly 27% so far this year and was on track to build on its record Monday.
Christians said the VIX move and the last-hour buying interest together “suggest a constructive environment for stocks, with several measures aligning with the 2016 election analog. For now, the weight of the evidence continues to favor the bulls, notwithstanding the typical gyrations associated with uptrends.”

