
Watch These QQQ Price Levels as Nasdaq 100 ETF Slides After Yesterday's Rally
Key Takeaways
The Invesco QQQ Trust ( QQQ ) tumbled Thursday after surging 12% yesterday following President Trump's announcement of a 90-day pause on many tariffs.
Wednesday's rally saw the tech heavy Nasdaq 100, the index that the exchange-traded fund tracks, post its biggest one-day gain since January 2001 at the height of the dotcom bubble .
The QQQ fund has closed lower six out of the last eight weeks and trades down about 13% since the start of the year, though Wednesday’s relief rally pared the lion’s share of the ETF’s post-" Liberation Day " losses. Tariff uncertainty, coupled with concerns over AI spending and slowing corporate earnings , have weighed heavily on the fund in recent months.
Below, we zoom out by taking a closer look at the QQQ fund’s weekly chart and use technical analysis to identify crucial price levels worth watching out for.
Volume Spike Amid Tariff-Driven Price Swings
Since minting its record high in mid-February, the QQQ fund slumped as much as 26% before yesterday’s impressive reversal, placing the correction in the same neighborhood as the 31% Covid-19 -induced drop between mid-February and late March of 2020.
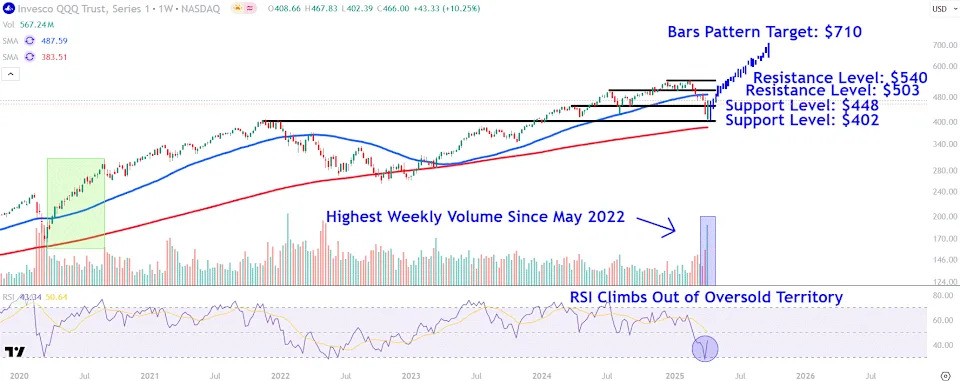
It’s worth pointing out that the fund has registered its highest weekly volume since May 2022, possibly indicating capitulation selling before larger market participants returned from the sidelines looking for buying opportunities after the steep sell-off.
Moreover, Wednesday's bullish reversal coincides with the relative strength index (RSI) climbing out of oversold territory. However, the indicator remains below the 50 threshold, a level that signals neutral price momentum.
Amid the potential for further tariff-fueled price swings, let’s identify crucial support and resistance levels on the QQQ fund’s chart that investors may be watching. We’ll also predict a longer-term upside target using bars pattern analysis.
Crucial Support Levels to Watch
The QQQ was down 5% at about $442 around midday Thursday.
It’s worth watching if the bulls can defend the $448 level before the end of the day. This area on the chartwill likely continue to attract plenty of scrutiny near last year’s prominent March peak and September trough.
Selling below this level could see the fund’s price revisit lower support around $402. Investors may place bids in this location near this week’s low, which closely aligns with a series of prices positioned just beneath the prominent November 2021 swing high .
Key Resistance Levels to Monitor
The start of a new move higher could initially run into overhead selling pressure at the $503 level. This area may provide resistance near last year’s notable July peak and the lower range of sideways drift on the chart throughout January.
A move above this level could fuel a rally to around $540. Those who have averaged into the fund on the way down may decide to lock in profits in this region near the December and February swing highs.
Bars Pattern Analysis
To project a potential longer-term upside target, investors can apply bars pattern analysis, a technique which analyzes historical price action to make future price predictions.
Given the current correction’s similarity of the Covid-era drop, we take the price bars comprising the initial move higher that followed the pandemic trough and overlay them from this week’s low. The analysis projects a target of around $710 if a similar uptrend were to unfold.
The comments, opinions, and analyses expressed on Investopedia are for informational purposes only. Read our warranty and liability disclaimer for more info.
As of the date this article was written, the author does not own any of the above securities.
Read the original article on Investopedia