Watch These Netflix Price Levels After Stock Hits Record High
Shares Rose on News of Strong Ad Sales

Key Takeaways
Netflix ( NFLX ) shares minted a new record high on Tuesday after the streaming giant reported a huge jump in advertising sales , bolstered by robust ad demand on its upcoming films, series, and live events.
The Californian-based company, which launched its cheaper ad-supported tier in November 2022, has placed an emphasis on ramping up its advertising business in recent quarters in an effort to score more ad dollars from premium live sports and help offset the costs of creating original content in a saturated streaming market.
Below, we take a look at the Netflix chart, while using technical analysis to identify key price levels to watch out for.
Shares Remain in Ascending Channel
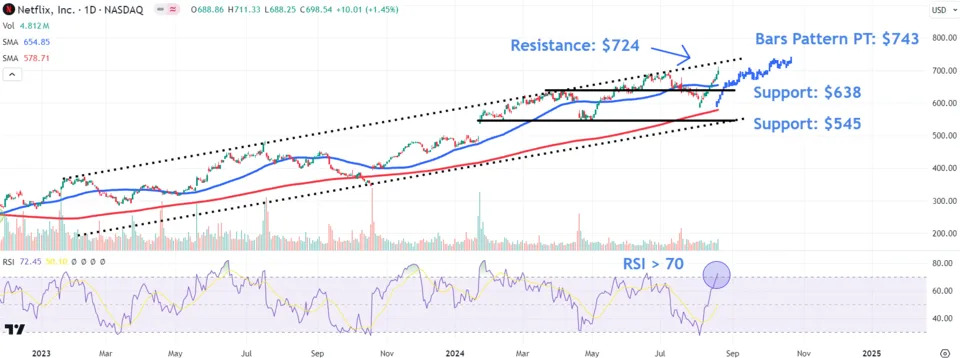
Netflix shares have traded within an ascending channel since January last year. More recently, this month’s broad-based equity market sell-off on Aug. 5 marked the end of a 13% correction in the stock.
Since then, the price has recovered to reclaim the 50-day MA, and it gained 1.5% Tuesday to close at its record high of $698.54.
However, it’s worth noting that the bullish move has occurred on lackluster trading volume , potentially indicating a lack of institutional investing .
Looking ahead, investors should eye several important chart areas where Netflix shares could attract interest.
Lower Price Levels to Watch
An initial area that may come into play during retracements sits around $638. This level could see buyers defend a horizontal line linking a range of comparable trading levels between March and early August.
A breakdown below this area could instigate a decline to lower support at $545, a location on the chart where investors may seek entry points near the Jan. 24 breakaway gap close and April swing low . This region also currently sits in the vicinity of the ascending channel’s lower trendline.
Higher Price Levels to Monitor
Short-term upward momentum could see the shares test the $724 level, where they may encounter selling pressure near the ascending channel’s upper trendline. Moreover, there’s an increased chance of profit-taking around this area, given the relative strength index (RSI) sits in overbought territory above the overbought 70 threshold.
To forecast a potential upside target above the stock’s record high, we can use a bars pattern. We do this by extracting the trending move in the shares from May to July and apply the pattern from the August low, which predicts a price target of around $743.
The comments, opinions, and analyses expressed on Investopedia are for informational purposes only. Read our warranty and liability disclaimer for more info.
As of the date this article was written, the author does not own any of the above securities.
Read the original article on Investopedia .

