The S&P 500 Snapped Its Monthlong Losing Streak—Here's What History Suggests Happens Next

Key Takeaways
Stocks were rising on Monday, building on small gains last week that snapped the S&P 500 ’s four-week losing streak.
The S&P 500 was up more than 1.5% in recent trading, putting the benchmark index up 4% since it fell into its first correction since 2023 earlier this month. The S&P 500 ticked up 0.5% last week, its first weekly gain since mid-February .
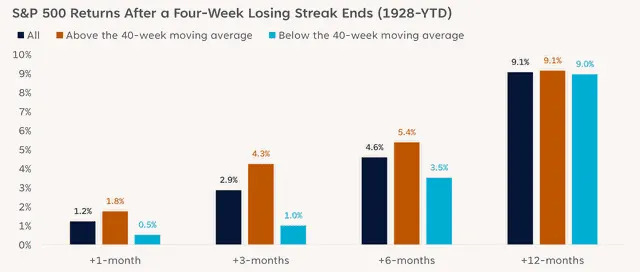
Four-week losing streaks are relatively rare, wrote LPL Financial Chief Technical Strategist Adam Turnquist in a note on Monday. They have occurred only 66 times since 1928, according to Turnquist. And, historically speaking, they tend to precede good times. After monthlong losing streaks, stocks have posted an average one-month gain of 1.2% and an average three-month gain of 2.9%. Six-month gains have averaged 4.6%.
These aren’t exceptional rallies ; they’re about average. The S&P 500’s average annual return is slightly more than 10%. But they’re gains nonetheless, which many investors would surely take with so many unknowns hanging over the market .
There is, however, a small caveat to Turnquist’s findings: The rebound out of a four-week slump tends to be much smaller if the S&P 500 falls below its 200-day moving average , as it did during the recent sell-off. In circumstances like the current moment’s, losing streaks have been followed by average one-month, three-month, and six-month returns of 0.5%, 1%, and 3.5%, respectively.

However, the 200-day moving average makes less of a difference in the long run. The S&P 500 tends to return about 9% in the year after a bad four-week stretch regardless of whether it’s above or below that threshold.
The 200-day moving average is a widely followed technical indicator . For legendary investor Paul Tudor Jones , it is a sign of more pain ahead . He has touted the 200-day moving average rule, which simply says that you get out when an asset’s price goes below that level. Few analysts are hard-liners in that way, but some warned investors should approach stocks with caution after the Nasdaq 100 and S&P 500 dipped below their 200-day averages earlier this month .
Read the original article on Investopedia

