
Reddit Stock Slips After Disappointing User Growth—Watch These Price Levels
Key Takeaways
Reddit ( RDDT ) shares were lower in early trading Thursday after the social discussion platform’s underwhelming user growth overshadowed better-than-expected quarterly results and an upbeat outlook.
While the company’s daily active unique visitors in the fourth quarter climbed 39% to an average of 101.7 million from a year earlier, the metric fell short of the 103.2 million consensus. In the quarterly shareholder letter , CEO Steve Huffman attributed the weaker engagement to a change in Google's ( GOOGL ) search algorithm but added that search-related traffic has recovered in the first quarter.
The company, which went public last March, has seen its shares surge more than 530% from its $34 initial public offering (IPO) price, boosted by growing advertising revenue and lucrative licensing agreements inked last year to integrate its content with Google and OpenAI artificial intelligence (AI) models.
Prior to Thursday’s drop Reddit shares had gained 32% since the start of the year, significantly outperforming the S&P 500 ’s 3% return over the same period.
Below, we take a close look at Reddit’s chart and use technical analysis to identify crucial post-earnings price levels that investors may be watching.
Bearish Divergence Signals Waning Momentum
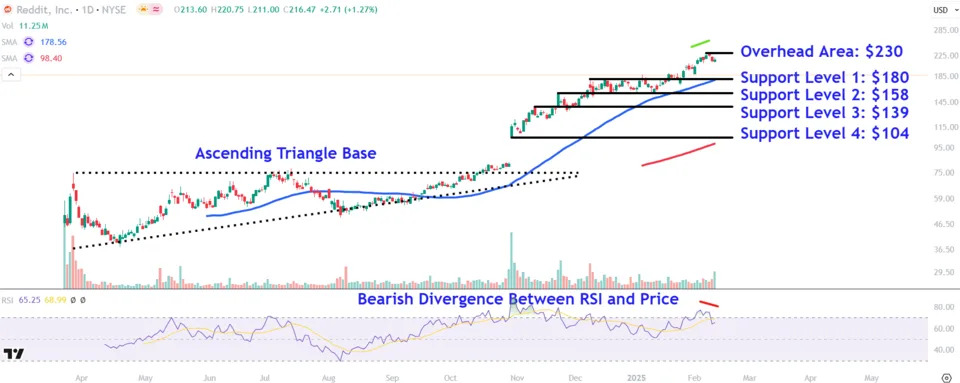
Reddit shares have continued to trend sharply higher after breaking out from an ascending triangle base in October last year.
However, more recently, the stock rallied to fresh record high on Monday but staged an intraday reversal to form a spinning top , a candlestick pattern that signals indecision among buyers and sellers. Moreover, as the price set a new high, the relative strength index (RSI) registered a shallower peak to create a bearish divergence , a technical sign pointing to a waning buying momentum.
Amid the stock’s projected earnings-driven drop today, let’s identify four crucial support levels where the price could encounter buying interest and also locate a key overhead areas to monitor during possible upswings.
Crucial Support Levels to Watch
Investors should initially watch the $180 level. The shares may find support in this area near the 50-day moving average (MA) , which closely aligns with a series of peaks on the chart extending back to early December.
The next lower support level to eye sits around $158. This price region could provide support near a trendline that connects last November’s high with the lower range of a narrow consolidation period on the chart between early December and mid-January.
Further downside may see the shares decline to $139, a level on the chart where they could attract buying interest near the early November peak , which also aligns with a minor trough later that month.
A decisive breakdown below this level opens the door for the shares to revisit lower support around $104. Investors may look to accumulate shares in this region near the low of the late October breakaway gap , which currently sits just above the closely observed 200-day MA.
Key Overhead Area to Monitor
During upswings, investors should keep track of the $230 level. Those who bought shares at lower prices may lock to lock in profits around the stock’s all-time high (ATH) .
The comments, opinions, and analyses expressed on Investopedia are for informational purposes only. Read our warranty and liability disclaimer for more info.
As of the date this article was written, the author does not own any of the above securities.
Read the original article on Investopedia