
Slow market tightening apparent in spot-to-contract spread

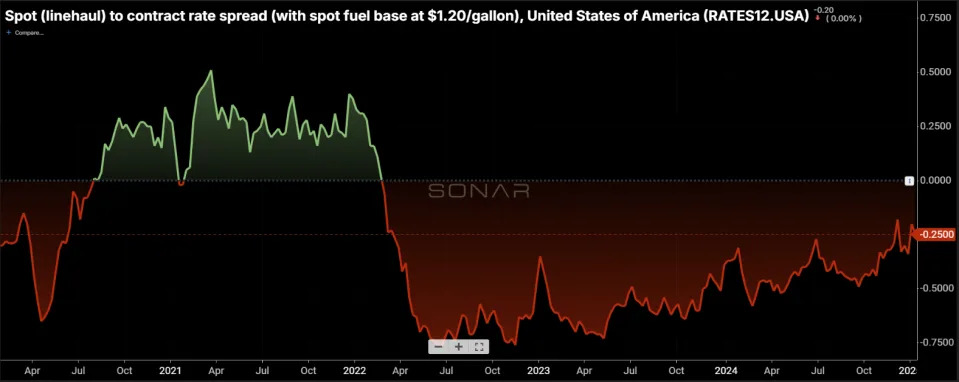
Chart of the Week: Spot (linehaul) to contract rate spread with spot fuel base at $1.20 – USA SONAR : RATES12.USA
The gap between dry van truckload contract and spot rates (excluding estimated fuel costs comparable to a standard fuel surcharge) has been steadily shrinking the past two and a half years. This near-linear trend is primarily driven by a continuous reduction in capacity paired with slow, yet remarkably consistent, demand growth — so subtle that it has been barely perceptible to market participants.
Describing the shift in truckload capacity as “slow tightening” may not be entirely accurate. Instead, it was a historic oversupply that has simply taken longer to correct than past instances of excess capacity. Nonetheless, the process has felt slow to most involved.
The truckload market collapsed in spring 2022 as the pandemic-era surge in government stimulus and prolonged quarantining came to an end. In near lockstep, shippers abruptly stopped requesting truckload capacity, bringing their monthslong strategy of overordering to a sudden halt.
Among transportation service providers, demand for their services fell by nearly 20% between February and May 2022. Over the same period, spot rates declined by 17%. Excluding the estimated impact of fuel costs, the transportation — or linehaul — portion of the cost fell by nearly 30%, as fuel prices surged following Russia’s invasion of Ukraine.
In a typical truckload market, spot rates are generally lower than contract rates, as they are negotiated in real time with numerous carriers that have full load and network visibility. However, when the market tightens and demand exceeds supply, spot rates spike above contract rates as service levels deteriorate and shippers bid against one another for capacity.
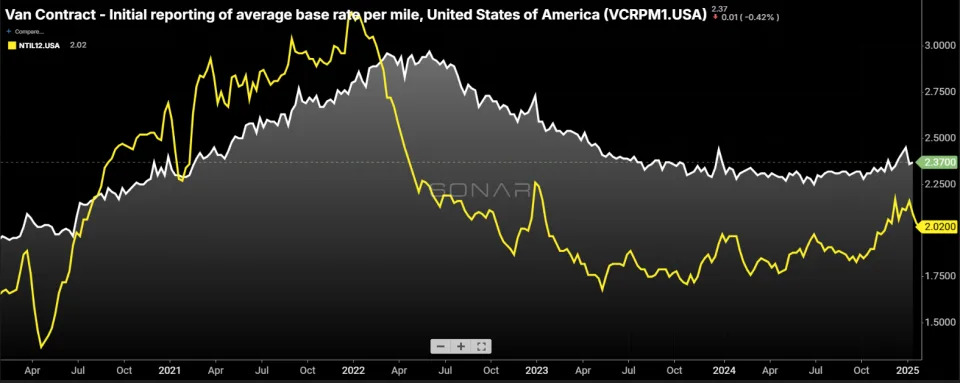
Much of the early shrinking of the spread between spot and contract rates can be attributed to contract rates declining at a faster pace than spot rates. By May 2023, spot rates hit their floor and began to inch higher — arguably marking the bottom of the freight recession.
However, this did not mean that conditions for carriers and non-asset based providers improved; they simply stopped getting worse. By that point, spot rates were averaging about 30% lower than contract rates. In contrast, in 2019 — a year also considered recessionary for trucking — spot rates averaged around 10%-15% lower than contract rates.
The bulk of the contract rate decline ended in 2023 but continued at a slower pace until the end of 2024, when, for the first time since early 2022, contract rates inched higher.
Prior to the seasonal bump in November and December, spot rates were hovering around a 16% discount to contract rates. In 2019, this spread was not enough to put upward pressure on contract rates. However, a new post-pandemic factor seems to be at play: expectation.
Despite the slow transition from extreme oversupply to a more moderate oversupply, there appears to be greater awareness of capacity tightening than in previous cycles. This shift could stem from increased vigilance, improved access to market data, a general belief among shippers that rate reductions have run their course, a focus on other cost factors or a combination of all these elements. Accepting rate increases may seem like the logical move — but is it?
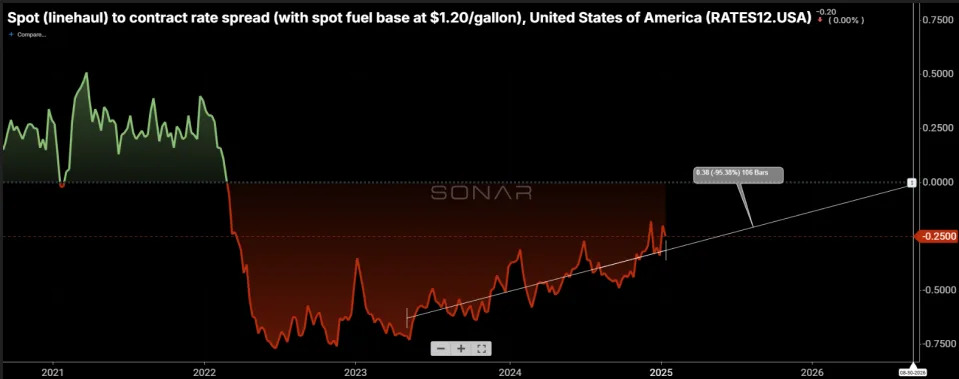
A basic linear regression model (not ideal for market forecasting) projects that the spread between spot and contract rates will not fully close until August 2026. However, this projection overlooks a key factor: As carrier optionality returns, market volatility typically increases, making a sharp market response more likely as spot rates approach contract rates.
Many truckload carriers have hinted at market recovery in recent earnings cycles, though most remain hesitant to make definitive calls. This uncertainty stems from the fact that the market is still balancing supply and demand.
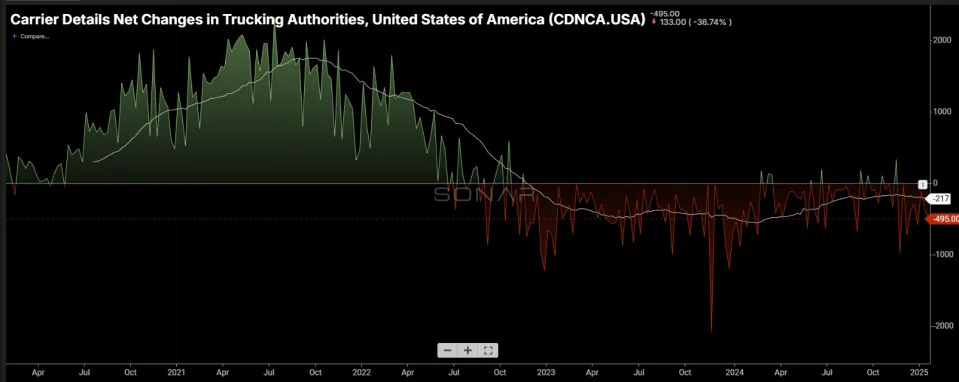
Capacity continues to exit the sector, with carrier departures outpacing new entrants. Seasonal accelerations in exits have been observed over the past month. Even as conditions improve for transportation providers, merely being “less bad” does not equate to a sustainable operating environment.
Both shippers and carriers seem to recognize that the market is moving toward a more volatile state. However, uncertainty remains regarding when that shift will occur and what form it will take.
About the Chart of the Week
The FreightWaves Chart of the Week is a chart selection from SONAR that provides an interesting data point to describe the state of the freight markets. A chart is chosen from thousands of potential charts on SONAR to help participants visualize the freight market in real time. Each week a Market Expert will post a chart, along with commentary, live on the front page. After that, the Chart of the Week will be archived on FreightWaves.com for future reference.
SONAR aggregates data from hundreds of sources, presenting the data in charts and maps and providing commentary on what freight market experts want to know about the industry in real time.
The FreightWaves data science and product teams are releasing new datasets each week and enhancing the client experience.
To request a SONAR demo, click here .
The post Slow market tightening apparent in spot-to-contract spread appeared first on FreightWaves .