
Truckload market tries to squash seasonal depression

This week’s FreightWaves Supply Chain Pricing Power Index: 40 (Shippers)
Last week’s FreightWaves Supply Chain Pricing Power Index: 40 (Shippers)
Three-month FreightWaves Supply Chain Pricing Power Index Outlook: 40 (Shippers)
The FreightWaves Supply Chain Pricing Power Index uses the analytics and data in FreightWaves SONAR to analyze the market and estimate the negotiating power for rates between shippers and carriers.
This week’s Pricing Power Index is based on the following indicators:
Volumes recovering from seasonal depression
The freight market continues to deal with seasonal depression as freight volumes remain lower than they were this time a month ago. The bright side is that tender volumes have turned positive year over year, which hasn’t been the case since the middle of November.
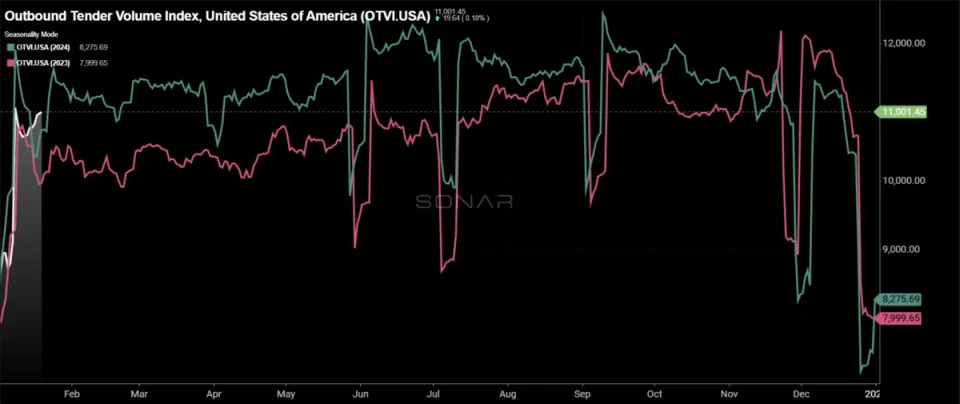
The Outbound Tender Volume Index (OTVI), a measure of national freight demand that tracks shippers’ requests for trucking capacity, has completely erased the holiday noise, and comparisons can now be formed. Over the past week, tender volumes have declined by 0.2% w/w, but they have been inching higher in recent days. The question for the week is, how does the Martin Luther King Jr. Day holiday impact tender volumes? Compared to this time last year, tender volumes are up 4.6%, but that has to do with the timing of the holiday being earlier in 2024.
As the new administration has officially taken office, it will be interesting to see how the first 100 days play out in terms of tariffs, as well as what that means for freight volumes. In the near term, the Lunar New Year is on the horizon and inbound ocean volumes are on the rise. Those ocean volumes will likely be more impactful to intermodal volumes rather than flow directly into the truckload market, given that time sensitivity in the first quarter is muted.
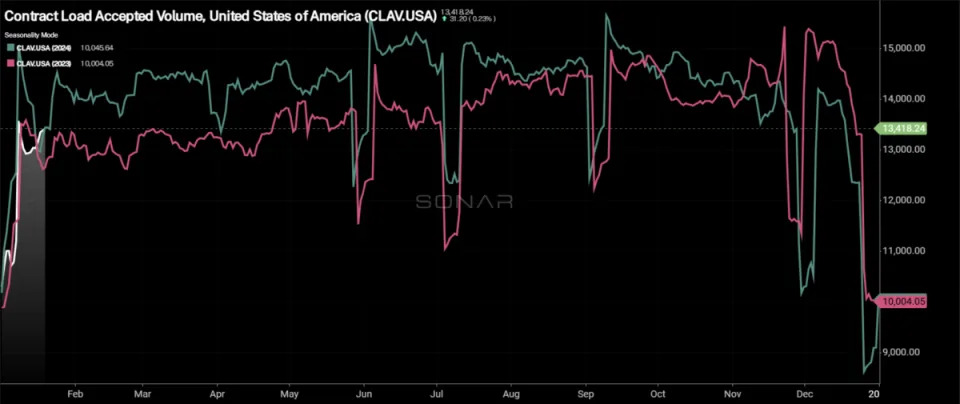
Contract Load Accepted Volume (CLAV) is an index that measures accepted load volumes moving under contracted agreements. In short, it is similar to OTVI but without the rejected tenders. Looking at accepted tender volumes, the decrease was greater than the overall OTVI as CLAV fell by 0.58% w/w, due to an uptick in tender volumes.
Bank of America’s most recent card spending report, for the week ending Jan. 11, was down 0.8% year over year. Spending across the board was lower, with the exception of online electronics, department stores and transit spending, which were all up 2.5% y/y. The biggest declines were in entertainment and furniture spending, which were down over 6% y/y. The declines in spending stem from significant winter weather that swept across the Midwest and South.
Even with a slight decline in tender volumes at the national level, the majority of freight markets experienced growth over the past week. Of the 135 markets tracked within SONAR, 83 reported higher volumes over the past week, down from 130 last week.
A fairly large increase in volumes across markets in the Midwest was impacted by the bitter cold. St. Louis and Jefferson City, Missouri, experienced 17.2% increases w/w.
Atlanta, one of the largest markets, if not the largest, on any given day saw tender volumes increase by 8.53% over the past week. That is among the strongest-volume weeks of all time.
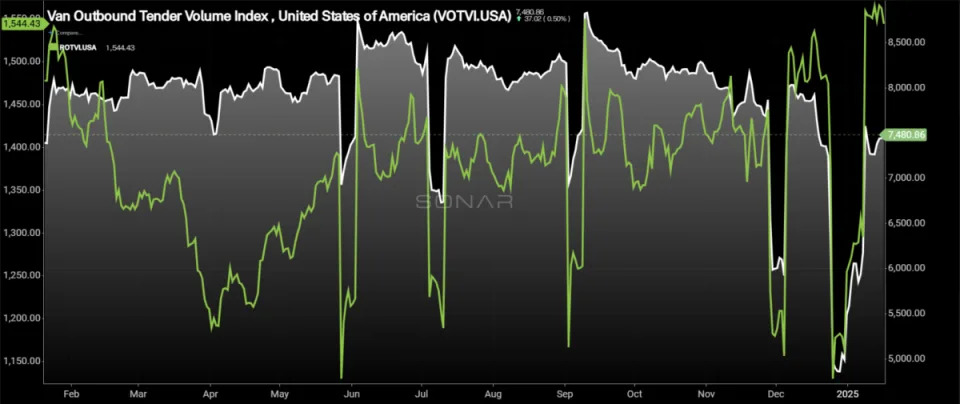
By mode: The dry van market rebounded this week, showing growth on a weekly basis after the holiday. The Van Outbound Tender Volume Index increased by 0.88% over the past week. Van volumes also crossed above year-ago levels this week, again in large part due to the MLK holiday, up 5% y/y.
The reefer side of the market experienced a decline in tender volumes over the past week, seeing a slight slowdown in positive momentum. The Reefer Outbound Tender Volume Index fell by 0.63% over the past week but is still up over 9% compared to this time last month and is 6.6% higher than it was this time last year.
Winter weather provides boost to tender rejection rates
Tender rejection rates have remained elevated after the holidays and severe winter weather passed. Bitter cold across the country is something to pay attention to early in the week as it could increase protect-from-freeze measures, disrupting capacity, especially in regions that typically don’t suffer from winter weather.
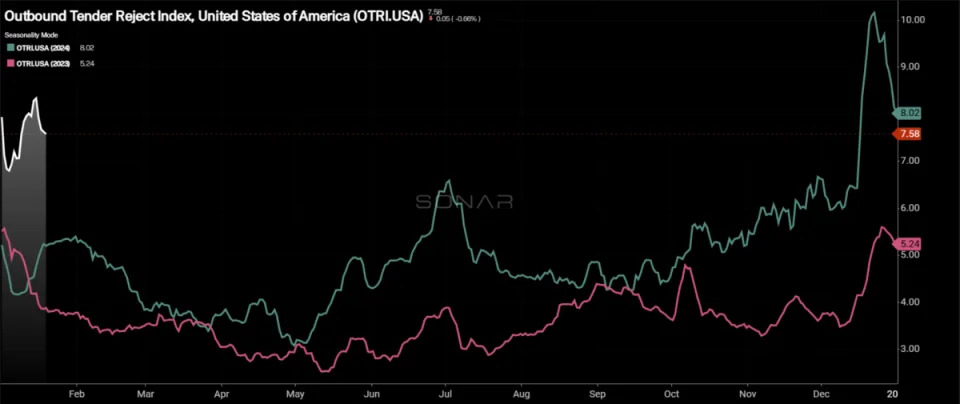
Over the past week, the Outbound Tender Reject Index (OTRI) was back on the rise, increasing by 35 basis points w/w to 7.92%. Though tender rejection rates are off the Christmas highs, the stickiness above 7% is a sign that capacity has exited the market and will continue to do so. Compared to this time last year, the OTRI is 280 bps higher y/y, a prime indication that the market is tighter, though it may not be felt by all market participants.
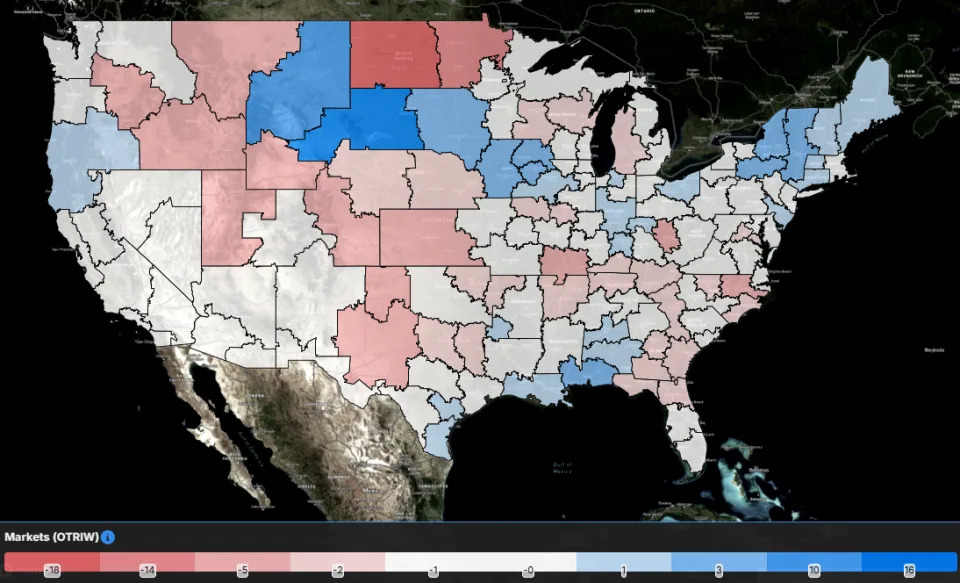
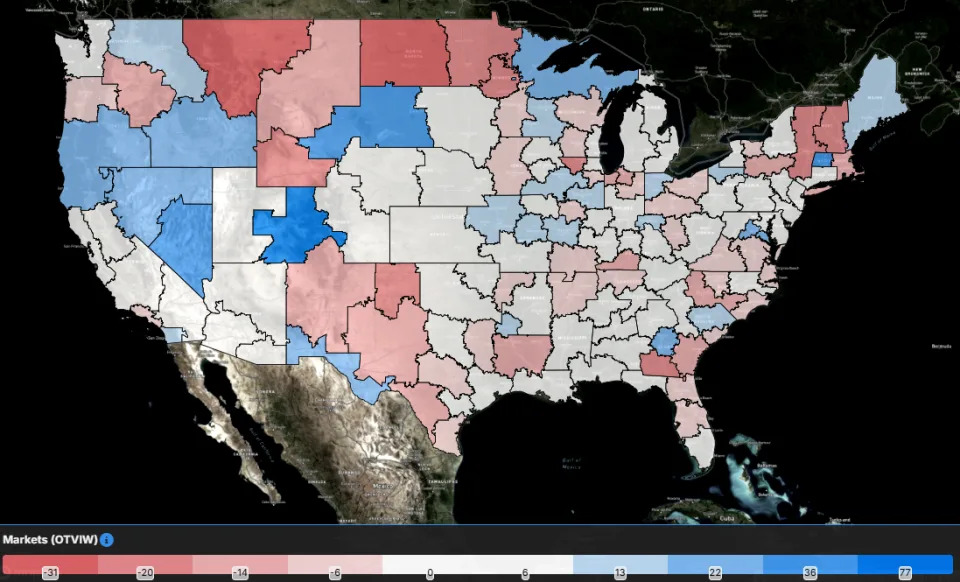
The map above shows the Outbound Tender Reject Index — Weekly Change for the 135 markets across the country. Markets shaded in blue are those where tender rejection rates have increased over the past week, whereas those in red and white have seen rejection rates decline. The bolder the color, the more significant the change.
Of the 135 markets, 56 reported higher rejection rates over the past week, down from the 77 that saw tender rejection rates rise in last week’s report.
The increases in rejection rates are stemming from weather-impacted markets that are fairly small in terms of volume. The largest increases in rejection rates are in markets across South Dakota, Montana and Iowa.
Many of the largest markets in the country saw rejection rates fall over the past week. They included Chicago, Atlanta and Harrisburg, Pennsylvania.
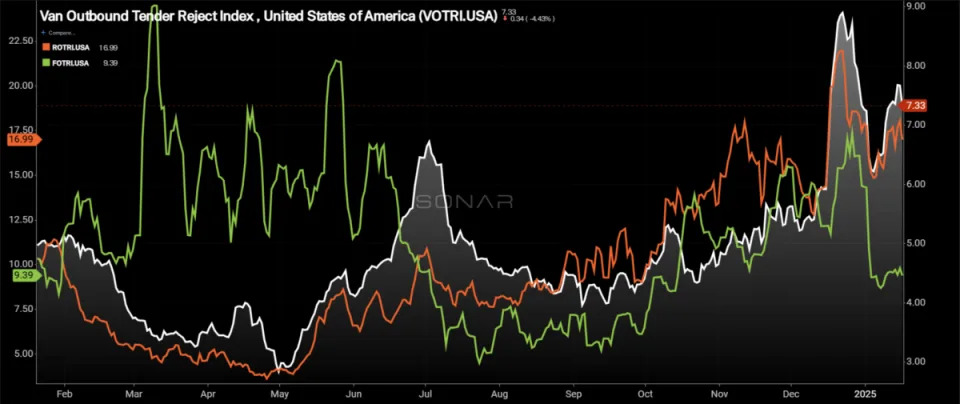
By mode: The dry van market continues to experience tender rejection rates below the other two equipment types, but they are holding above 7% and didn’t collapse following the holidays. The Van Outbound Tender Reject Index increased by 29 bps over the past week to 7.33%, now 239 bps higher than it was this time last year.
The reefer market continues to show that it is significantly tighter than the van market as tender rejection rates are more than double van rejection rates. The Reefer Outbound Tender Reject Index increased by 68 bps over the past week to 16.99% and is 788 bps higher year over year. Increased protect-from-freeze measures create even more pressure on reefer capacity, boosting rejection rates during the winter weather.
The flatbed market has been fairly stable over the past week, but rejection rates remain depressed for the smallest market of the three equipment types within SONAR. The Flatbed Outbound Tender Reject Index increased by 5 bps over the past week to 9.39%, but flatbed rejection rates are 24 bps lower than they were this time last year.
Spot rates sticky near 52-week highs
With tender rejection rates remaining sticky above 7% on the national level, spot rates are showing stickiness at elevated levels. While the increases to spot rates after the new year aren’t large, it shows that the market has shifted back toward the carriers’ favor to some degree in recent months.
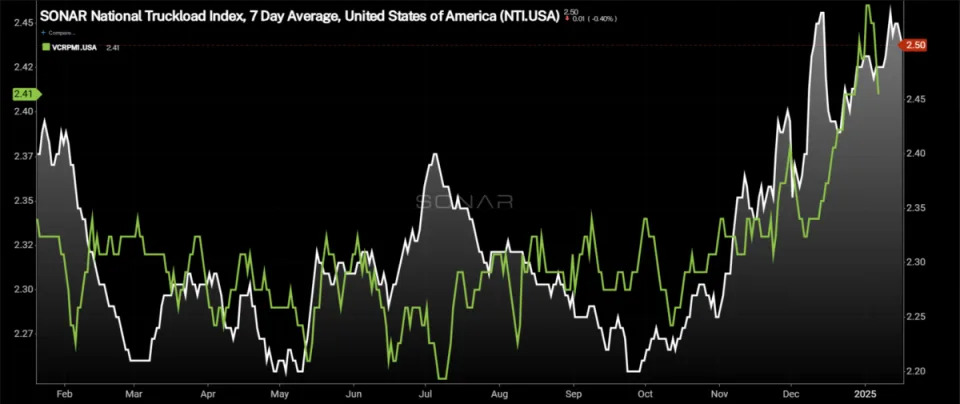
The National Truckload Index – which includes fuel surcharge and various accessorials – increased by 1 cent per mile over the past week to $2.50. The NTI is 17 cents per mile higher than it was this time last year and 7 cents per mile higher than it was this time last month. The linehaul variant of the NTI (NTIL) – which excludes fuel surcharges and other accessorials – was unchanged over the past week at $1.95. The NTIL is 23 cents per mile higher, widening the gap with last year’s levels significantly over the past week as spot rates have been resilient in the new year.
Initially reported dry van contract rates, which exclude fuel, continued to rise as the data is now capturing the increases associated with the holidays. Rates are up 5 cents per mile over the past week to $2.46. Compared to this time last year, the van contract rate is up 3 cents per mile as the holiday impacts are starting to be removed from the rates, which are reported on a 14-day lag.
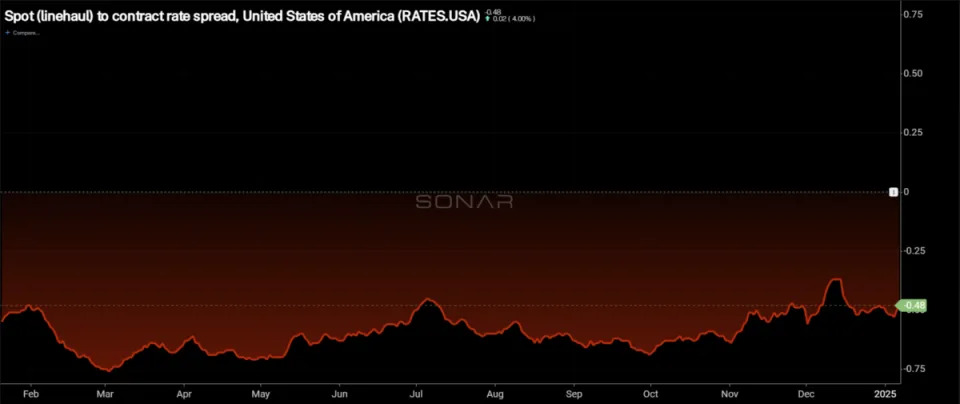
The chart above, showing the spread between the NTIL and dry van contract rates, is trending back to pre-pandemic levels. The spread remains wide, but with the recent moves in both spot and contract rates, it moved slightly wider than it was a week ago. Over the past week, the spread widened by 2 cents to minus 52 cents. Compared to this time last year, the spread is 10 cents per mile narrower than it was, another sign that the market is moving to a more carrier-friendly environment.
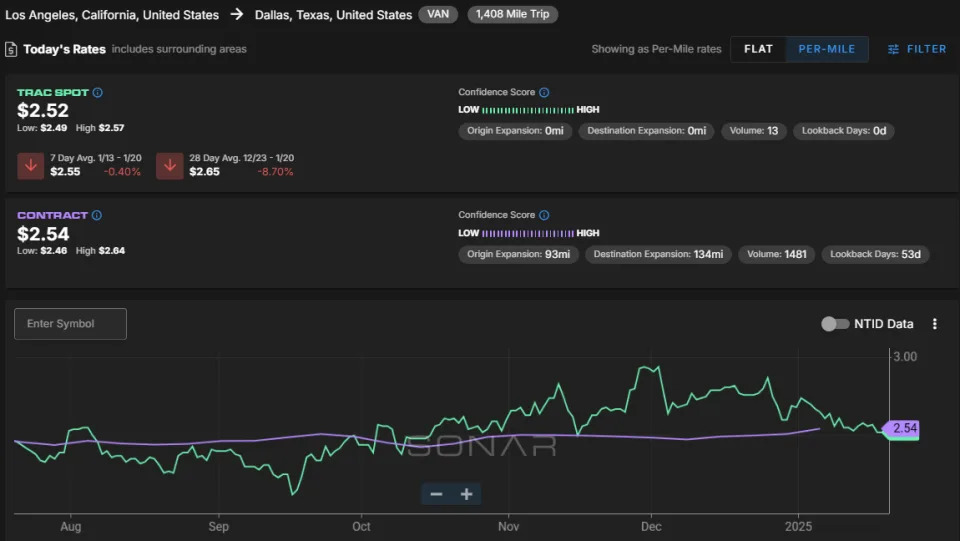
The SONAR Trusted Rate Assessment Consortium spot rate from Los Angeles to Dallas suffered a fairly large slide over the past week, dipping below the contract rate once again. The TRAC rate from Los Angeles to Dallas decreased by 9 cents per mile to $2.61. Spot rates along this lane are 7 cents per mile above the contract at present.
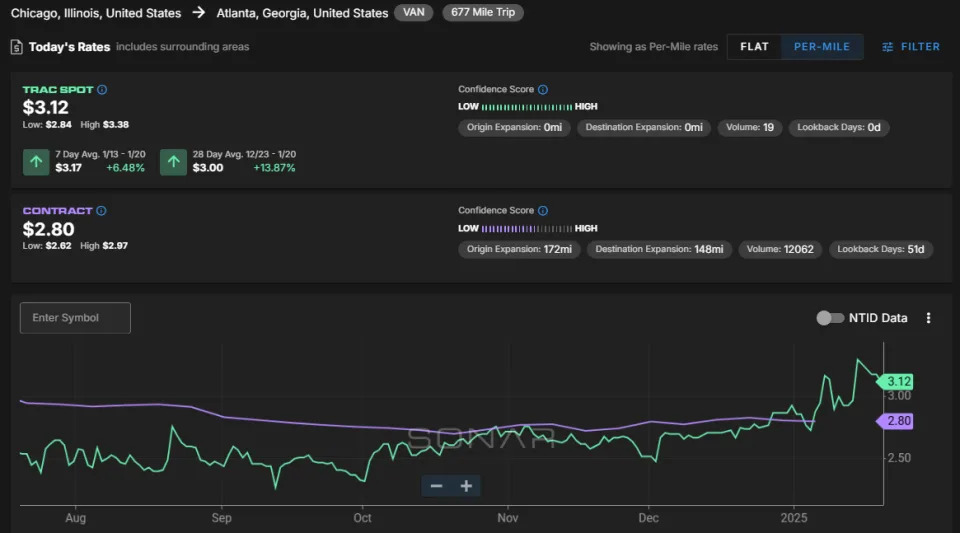
From Chicago to Atlanta, spot rates have been volatile, finally moving above contract rates and to the highest level in the past six months. The TRAC rate for this lane increased over the past week by 22 cents per mile to $3.12. Spot rates are now 32 cents per mile higher than contract rates, which could lead to tighter conditions along this lane.
The post Truckload market tries to squash seasonal depression appeared first on FreightWaves .