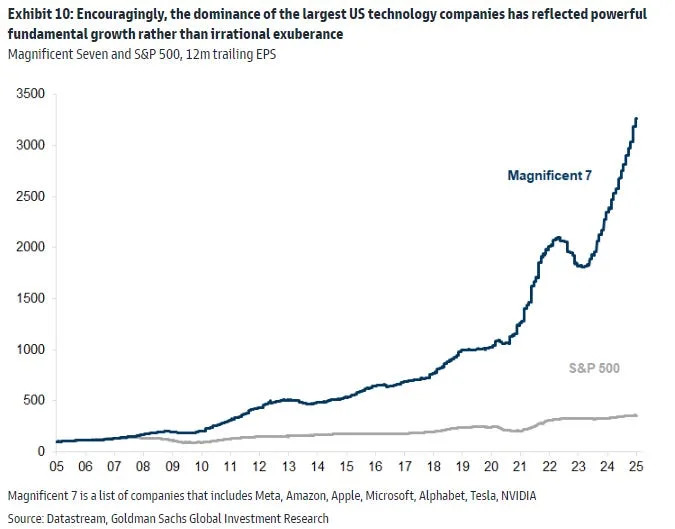
One chart shows why mega-cap tech continues to dominate the stock market

One chart encapsulates why mega-cap tech stocks have dominated the broader stock market over the past few years.
Goldman Sachs this week provided this striking chart, which measures the trailing 12-month earnings per share of the "Magnificent 7" stocks — Apple , Amazon , Alphabet , Microsoft , Meta Platforms , Nvidia , and Tesla — versus the S&P 500 .

The chart is a stark reminder that profits are the key driver of stock prices in the long term.
Since its launch in April 2023, the Roundhill Magnificent Seven ETF has returned 129%, more than double the S&P 500's 48% return over the same time period.
But that outperformance simply reflects the earnings dominance of the mega-cap tech stocks, according to Goldman.
"Encouragingly, the dominance of the largest US technology companies has reflected powerful fundamental growth rather than irrational exuberance," Peter Oppenheimer, a strategist at Goldman Sachs, said in a note on Thursday.
Oppenheimer highlighted that the Magnificent 7 tech stocks are expected to have shown earnings growth of 33% in 2024, compared to just 3% growth for the rest of the S&P 500.
That's after the cohort of mega-cap tech stocks delivered earnings growth of 36% in 2023, compared to a 4% decline in earnings growth for the rest of the S&P 500.
An AI revolution has helped power much of the earnings bonanza over the past two years, especially for Nvidia, which has seen its trailing 12-month net income soar from about $6 billion before the AI boom to more than $60 billion today.
While mega-cap tech names are expected to continue to grow their earnings faster than the rest of the stock market in 2025 and 2026, the gap is set to narrow considerably.
Consensus estimates expect 18% and 16% growth for the Magnificent 7 in 2025 and 2026, compared to 11% and 13% growth for the rest of the S&P 500 in those years.
Read the original article on Business Insider

